
Overall Score
6
of AI companies

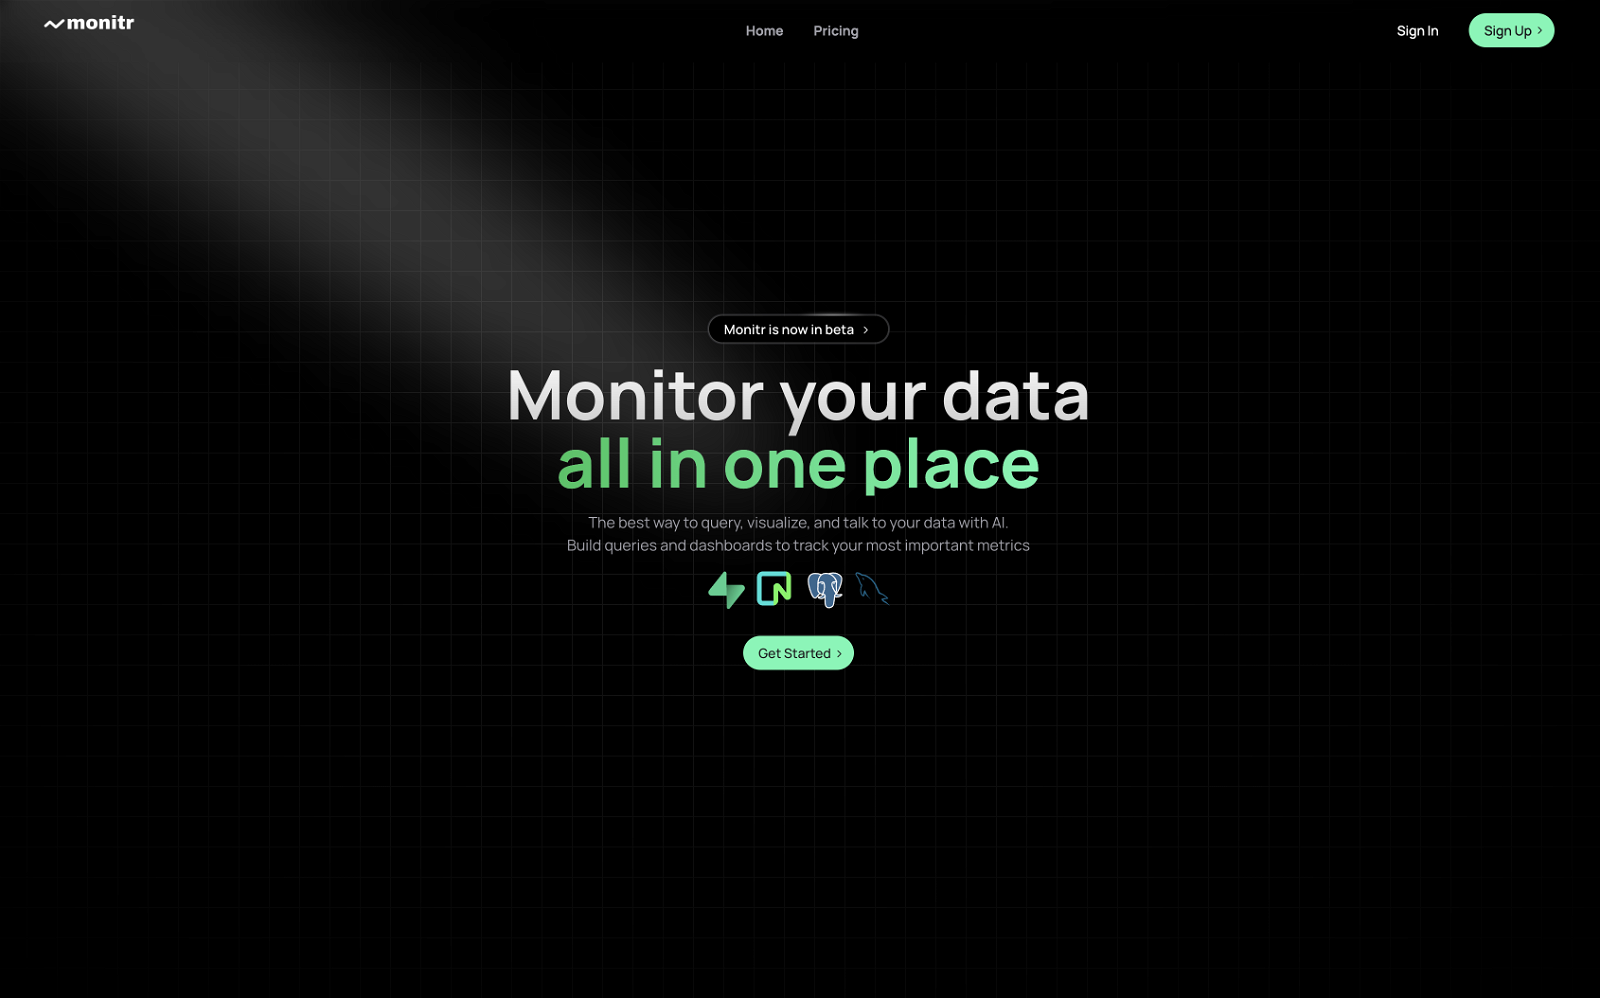
The best way to query, visualize, and talk to your data with AI. Build queries and dashboards to track your most important metrics. Connect
The best way to query, visualize, and talk to your data with AI. Build queries and dashboards to track your most important metrics. Connect various data sources, including PostgreSQL, MySQL, or any data source with an API endpoint. Sign up, connect a database, and start asking an AI assistant ques...
Overall Score
6
of AI companies
Overall Score
6
GitHub Stars
505
Monthly Visits
0
Community Rating
2.3
The best way to query, visualize, and talk to your data with AI. Build queries and dashboards to track your most important metrics. Connect various data sources, including PostgreSQL, MySQL, or any data source with an API endpoint. Sign up, connect a database, and start asking an AI assistant ques...
Latest detected signals across traffic, developer activity and community mentions.
Indexed by indexator.ai
Last GitHub push
GitHub repo created
| Keyword | Volume / Mo | CPC |
|---|---|---|
| monitr | 760 | $0.05 |
Pro
—
Free trial available
The best way to query, visualize, and talk to your data with AI. Build queries and dashboards to track your most important metrics. Connect various data sources, including PostgreSQL, MySQL, or any data source with an API endpoint. Sign up, connect a database, and start asking an AI assistant ques...
Get notified when score, traffic, GitHub or community signals change.
Latest detected signals across traffic, developer activity and community mentions.
Indexed by indexator.ai
Last GitHub push
GitHub repo created
Six signals, each 0–100, blended into the overall by their listed weight.
Generated from public signals and search intent.
Each dimension is weighted (traffic 20% · community 25% · growth 15% · momentum 15% · innovation 10%) and combined into the overall.
| Keyword | Volume / Mo | CPC |
|---|---|---|
| monitr | 760 | $0.05 |
Pro
—
51.0K
Rating
2.3
3 reviews
Views
5.4K
Category
Data analysis
Pros · 16
Cons · 7
Rating distribution
User reviews · 1
Doesn't support mongoDB and Firebase.
Release history · 1+
Initial release of Monitr.
Q&A · 17
Monitr is a data visualization and analytics platform. The purpose of Monitr is to aid in making data-driven decisions by enabling users to query, visualize, and share their data effortlessly. It works by breaking down data silos, providing a unified view of multiple data sources, and creating charts and dashboards for tracking crucial metrics. It is cloud-based, supports various data sources, and incorporates AI features for enhanced analytics.
Monitr breaks down data silos by offering a platform where users can connect and track data from multiple disparate sources, thus enabling a unified visualisation of data from these sources. This integration across sources provides an end-to-end view eliminating data isolation.
Monitr can connect with data sources that include PostgreSQL, MySQL, and any other data source with an API endpoint. This makes it very versatile as it can integrate data from various systems or databases.
Monitr providing a 'unified view of data' means it integrates data from different sources, eliminating the need to switch between various tools or platforms for different sets of data. It consolidates all data streams into a single view, helping users get insightful and holistic views of their data.
You can visualize data with Monitr by creating charts and dashboards. These visualizations provide a direct and efficient way to monitor most critical metrics and make informed, data-driven decisions.
Alternatives — peer set
Uncover hidden trends and patterns in your data effortlessly.
Data cleaning & visualization for insights gained.
Automate data work and reporting with AI Agents. No data|coding skills required.
Turn your data chaos into meaningful insights
AI data analyst that transforms datasets into dashboards.
AI-assisted graphs and insights in 30 seconds!
How do you feel about this company?
Your vote helps improve ranking signals.
Badge
A lightweight SVG badge showing the score.
<a href="https://indexator.ai/companies/monitr" target="_blank" rel="noopener">
  <img src="https://indexator.ai/api/embed/badge/monitr" alt="Monitr Score on Indexator.ai" width="200" height="60" />
</a>Score Card
An embeddable card with score breakdown.
<iframe src="https://indexator.ai/api/embed/card/monitr" width="300" height="200" frameborder="0" style="border:none;border-radius:8px"></iframe>Category Leaderboard
Top 10 in Data & Infrastructure.
<iframe src="https://indexator.ai/api/embed/leaderboard?category=Data%20%26%20Infrastructure" width="300" height="400" frameborder="0" style="border:none;border-radius:8px"></iframe>