Overall Score
19
Top 25%
of AI companies
by ChartPixel
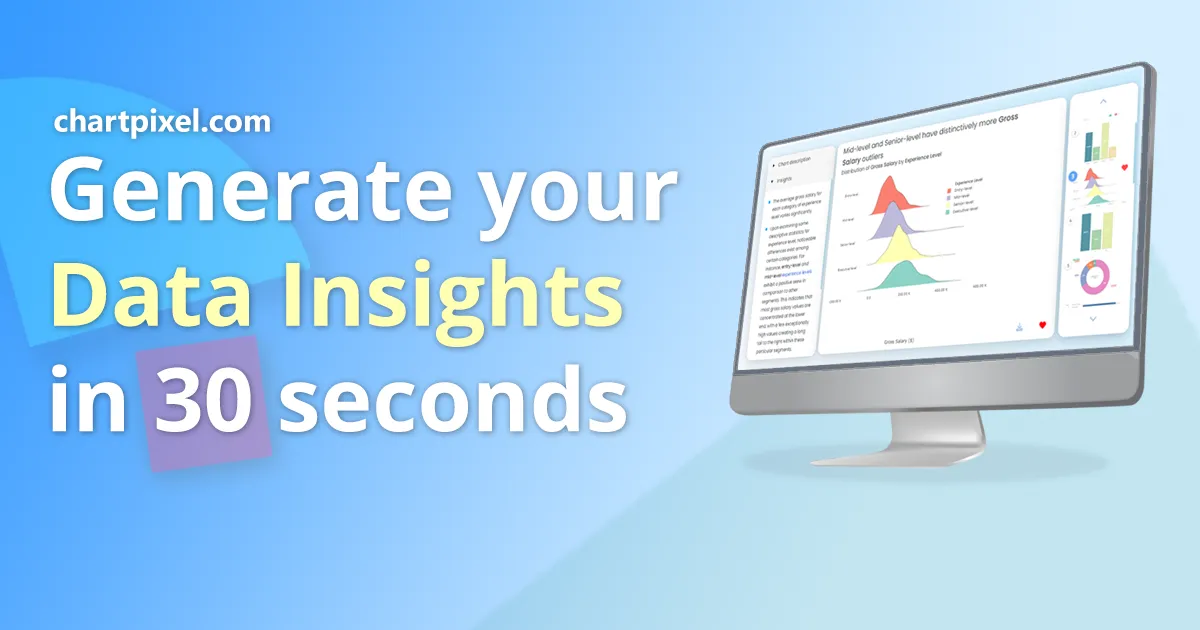
ChartPixel instantly provides powerful AI-driven data analysis, interactive charts & graphs, and actionable insights from your messy data or questionnaires.
Unleash AI-driven data visualization and analysis, effortlessly, with ChartPixel.
Overall Score
19
Top 25%
of AI companies
Overall Score
19
GitHub Stars
0
Monthly Visits
5K
Community Rating
4.1
Unleash AI-driven data visualization and analysis, effortlessly, with ChartPixel.
Latest detected signals across traffic, developer activity and community mentions.
Indexed by indexator.ai
Launched on Product Hunt
| Keyword | Volume / Mo | CPC |
|---|---|---|
| chartpixel | 350 | — |
| ai chart analysis | 750 | $2.13 |
| chart pixel ai | 160 | — |
| classical charting ai | 60 | — |
| chart analyzer ai | 310 | — |
Contact sales — no public pricing tiers.
**Your raw data is not sent to LLMs.** ChartPixel distinguishes itself with its AI-assisted data analysis and visualization capabilities. It's not just about graph generation; it's about generating actionable insights backed by statistics. It's designed to be intuitive, eliminating t...
Get notified when score, traffic, GitHub or community signals change.
Latest detected signals across traffic, developer activity and community mentions.
Indexed by indexator.ai
Launched on Product Hunt
Six signals, each 0–100, blended into the overall by their listed weight.
Generated from public signals and search intent.
Each dimension is weighted (traffic 20% · community 25% · growth 15% · momentum 15% · innovation 10%) and combined into the overall.
| Keyword | Volume / Mo | CPC |
|---|---|---|
| chartpixel | 350 | — |
| ai chart analysis | 750 | $2.13 |
| chart pixel ai | 160 | — |
| classical charting ai | 60 | — |
| chart analyzer ai | 310 | — |
Saves
51.0K
Rating
4.1
17 reviews
Views
14.1K
Category
Data analysis
Pros · 32
Cons · 7
Rating distribution
User reviews · 7
I really value the sentiment analysis tool—it simplifies understanding customer feedback by picking up on their emotions. Plus, the way it groups comments into topics is super helpful for decision-making.
The one-click forecasts are great. They save me a lot of time when I need to make predictions based on my data. I also like the fact that I can encrypt sensitive columns.
Supported features
Release history · 1+
Initial release of ChartPixel.
Q&A · 22
ChartPixel is a simplified chart generation and insights platform that leverages artificial intelligence to transform raw data into visually appealing and insightful charts. It demystifies the complexity of data analysis tools, providing an accessible way to understand and utilize data effectively. The platform can convert data insights into presentations like PowerPoint and integrates data from the web broadening analysis capabilities, regardless of the user's skill level.
ChartPixel transforms data into charts through a process of instant visualization. It automatically converts uploaded data into an array of explained charts and summary insights, thereby enhancing comprehension. The platform cleans up messy data, identifies the most relevant columns, and suggests meaningful features to give a comprehensive interpretation of data.
ChartPixel handles various types of data for different projects, including survey data, customer data, public data, business data, financial data, sports data, and research data. The source of the data can range from jot-down numbers, data files, webpages, or even links to databases.
ChartPixel's Smart Data Analysis works by using AI algorithms to auto-select the most relevant columns for chart creation. It cleans up messy data and suggests meaningful features to provide a comprehensive interpretation of the data. The algorithm identifies patterns in the data and provides insight into the most important features.
Yes, users can effortlessly convert the data insights generated by ChartPixel into visually impressive and statistically accurate PowerPoint presentations. This seamless transformation helps users craft compelling presentations without the need for advanced technical skills.
Alternatives — peer set
Uncover hidden trends and patterns in your data effortlessly.
Data cleaning & visualization for insights gained.
Automate data work and reporting with AI Agents. No data|coding skills required.
Turn your data chaos into meaningful insights
AI data analyst that transforms datasets into dashboards.
Analyze your Excel spreadsheet or CSV in seconds!
How do you feel about this company?
Your vote helps improve ranking signals.
Badge
A lightweight SVG badge showing the score.
<a href="https://indexator.ai/companies/chartpixel" target="_blank" rel="noopener">
<img src="https://indexator.ai/api/embed/badge/chartpixel" alt="ChartPixel Score on Indexator.ai" width="200" height="60" />
</a>Score Card
An embeddable card with score breakdown.
<iframe src="https://indexator.ai/api/embed/card/chartpixel" width="300" height="200" frameborder="0" style="border:none;border-radius:8px"></iframe>Category Leaderboard
Top 10 in Data & Infrastructure.
<iframe src="https://indexator.ai/api/embed/leaderboard?category=Data%20%26%20Infrastructure" width="300" height="400" frameborder="0" style="border:none;border-radius:8px"></iframe>Poor, couldn't handle a simple Excel spreadsheet with 1300 entries, waste of time.
Hi, we are sorry to hear. We quickly checked and seems an empty column made the analysis not work. We normally account for empty columns in between data columns, but it stopped your analysis this time. Please kindly remove that column and try to upload again. Let us know how it goes via the feedback button on your workspace, or you can email us too.
Hi, we added a fix now,so it will work with the empty column. Let us know how it goes.