
Overall Score
21
Top 25%
of AI companies

by Graphy🇬🇧
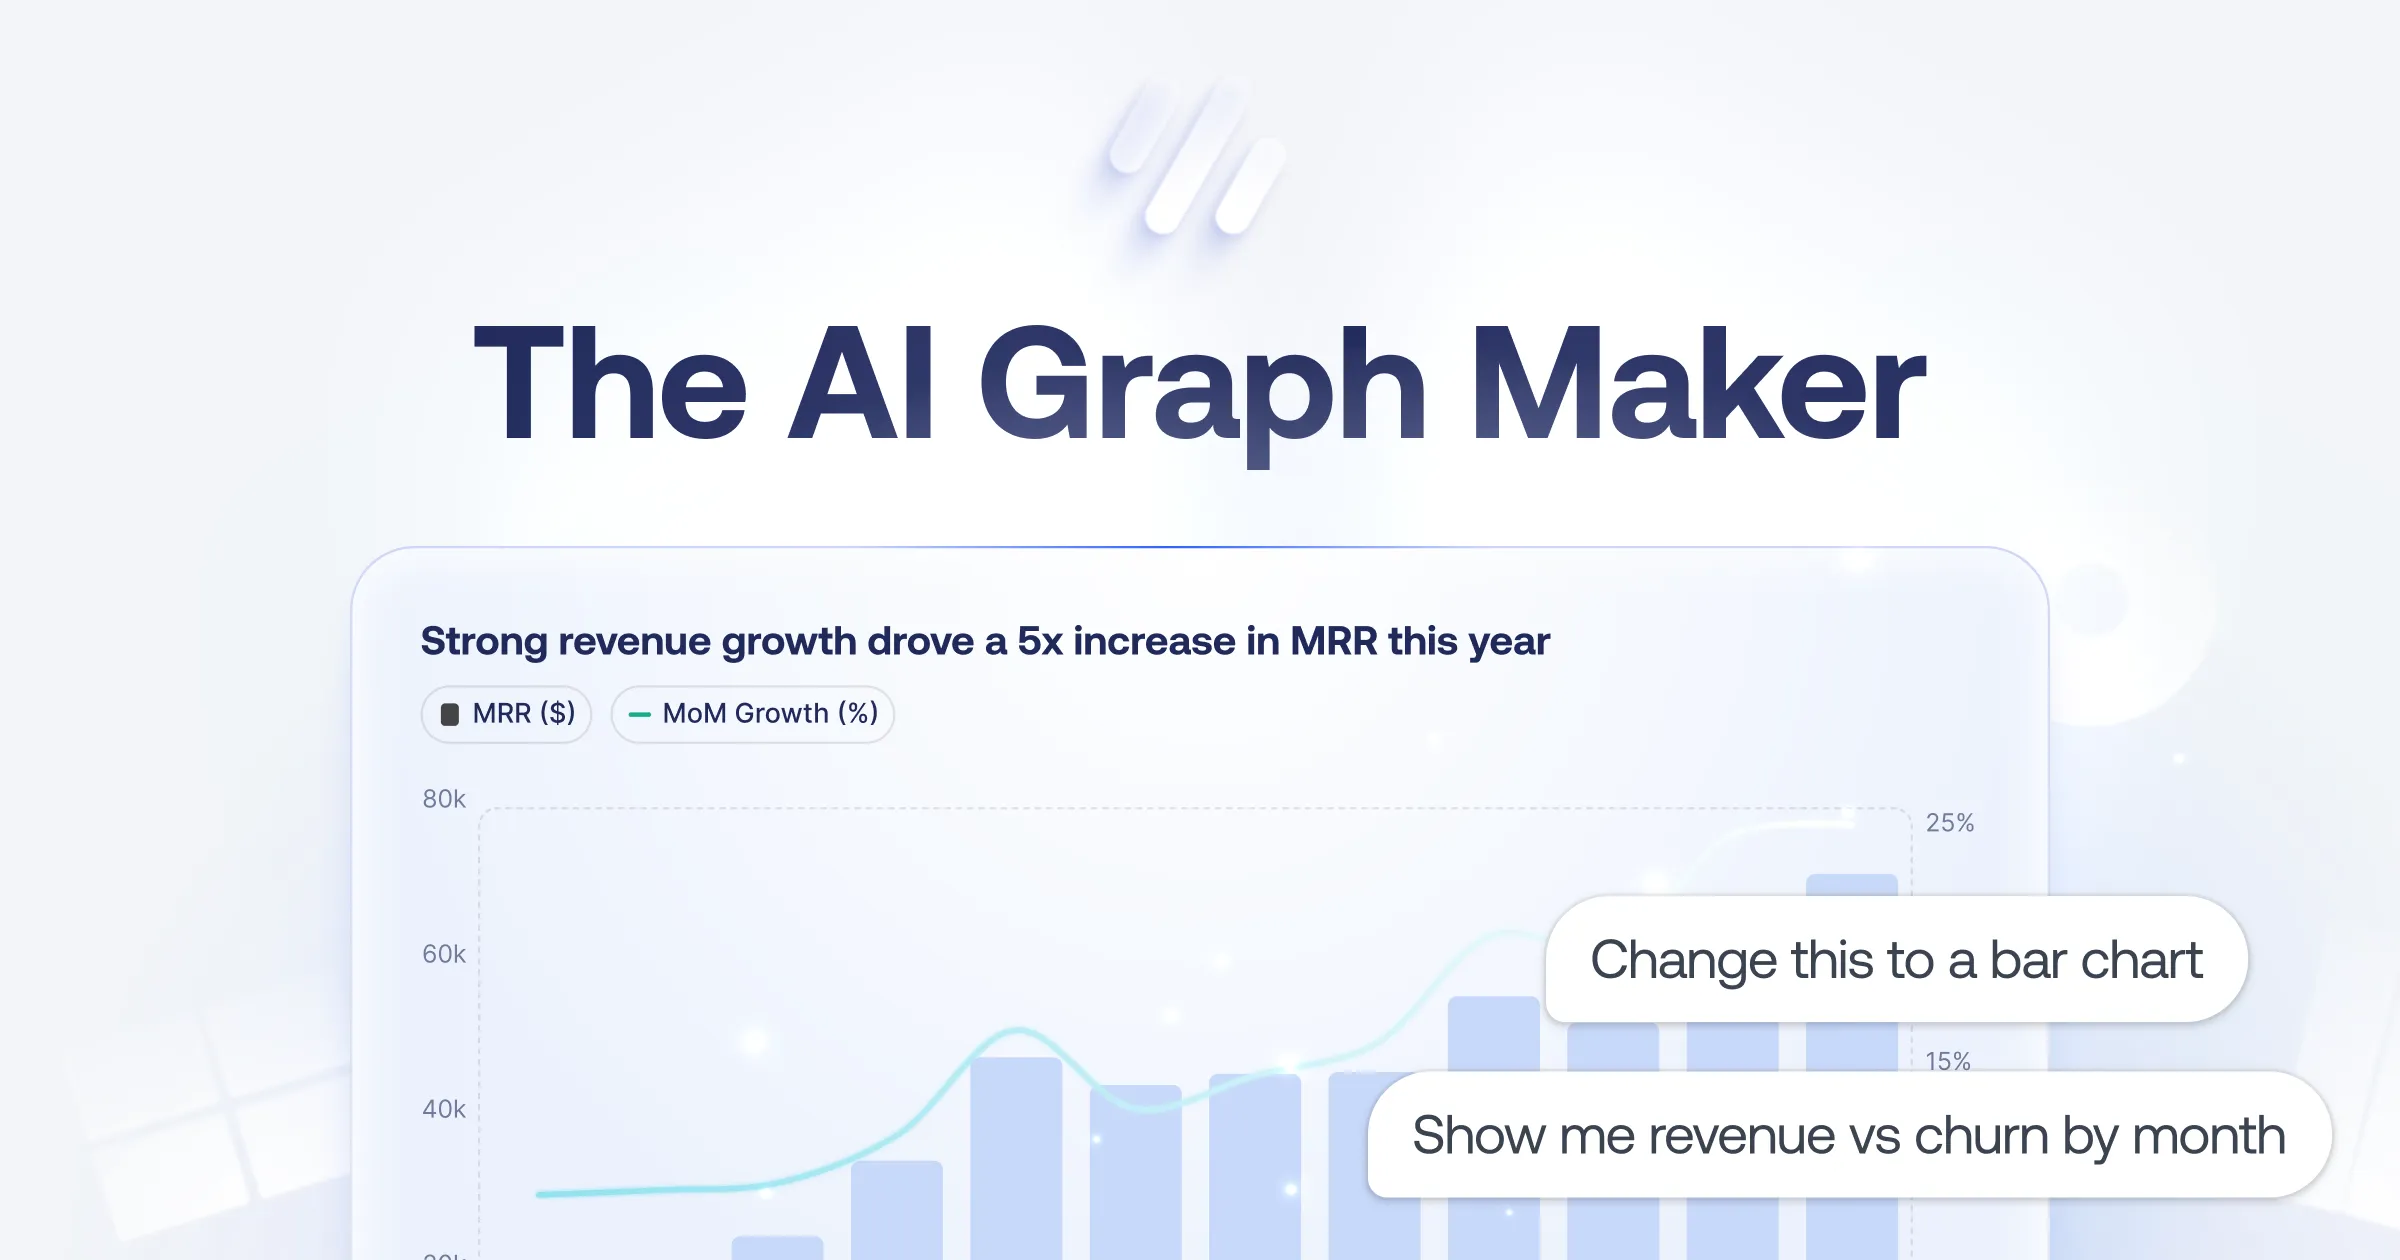
Graphy enables anyone to become a skilled data storyteller, by radically simplifying the way data is presented and communicated.
Revolutionizes data visualization with AI insights and seamless integrations.
Overall Score
21
Top 25%
of AI companies
Overall Score
21
GitHub Stars
0
Monthly Visits
168K
Community Rating
4.0
Revolutionizes data visualization with AI insights and seamless integrations.
Latest detected signals across traffic, developer activity and community mentions.
Indexed by indexator.ai
Featured on Product Hunt
| Keyword | Volume / Mo | CPC |
|---|---|---|
| graphy | 26,550 | $1.91 |
| graphy ai | 1,060 | — |
| graph maker | 60,220 | $1.49 |
| graph ai | 2,650 | $3.80 |
| graph generator | 9,110 | $0.95 |
Graphy is a free chart-maker tool that allows businesses to easily create slick and interactive data visualizations. With the help of artificial intelligence, this tool enables users to generate stunning charts without the need for advanced technical skills. The charts can be embedded into various p...
Get notified when score, traffic, GitHub or community signals change.
Latest detected signals across traffic, developer activity and community mentions.
Indexed by indexator.ai
Featured on Product Hunt
Six signals, each 0–100, blended into the overall by their listed weight.
Generated from public signals and search intent.
Each dimension is weighted (traffic 20% · community 25% · growth 15% · momentum 15% · innovation 10%) and combined into the overall.
| Keyword | Volume / Mo | CPC |
|---|---|---|
| graphy | 26,550 | $1.91 |
| graphy ai | 1,060 | — |
| graph maker | 60,220 | $1.49 |
| graph ai | 2,650 | $3.80 |
| graph generator | 9,110 | $0.95 |
Saves
60.7K
Rating
4.0
5 reviews
Views
23.7K
Category
Charts
Pros · 19
Cons · 9
Rating distribution
User reviews · 4
Although I have accessed this in the free mode but there is a limit of 5 charts in this mode. Lastly it has made that chart absolutely brilliant so the issue is that if it's in the free mode then at least it should give the option of at least 25 charts.
Release history · 1+
Initial release of Graphy app.
Q&A · 22
Graphy is a free chart-maker tool powered by AI, which enables businesses to create interactive and slick data visualizations.
Key features of Graphy include a range of chart options, AI-powered quick chart generation, an option to switch to table view, the ability to embed charts into platforms like Notion, and an intuitive, user-friendly interface.
The AI in Graphy works by using advanced algorithms to process input data, identify patterns, and generate interactive and visually appealing charts. This helps users to create stunning charts without the need for technical expertise.
To use Graphy for business, you simply need to input your data into the tool, choose a suitable chart type from a range of options, and allow the AI to generate your chart. The charts can then be embedded into your preferred applications for sharing and presentation.
Yes, Graphy offers multiple options for chart types. These can be used to represent different kinds of data, such as startup monthly expenses, user sessions in specific time frames, or customer funnel analysis.
Alternatives — peer set
Bring your ideas to life with a visual copilot
Create charts instantly with natural language.
Create any chart instantly with AI
Transform data into professional charts in seconds.
Transform economic data into hand-drawn visualizations.
Generate AI tools instantly with pie chart
How do you feel about this company?
Your vote helps improve ranking signals.
Badge
A lightweight SVG badge showing the score.
<a href="https://indexator.ai/companies/graphy" target="_blank" rel="noopener">
  <img src="https://indexator.ai/api/embed/badge/graphy" alt="Graphy Score on Indexator.ai" width="200" height="60" />
</a>Score Card
An embeddable card with score breakdown.
<iframe src="https://indexator.ai/api/embed/card/graphy" width="300" height="200" frameborder="0" style="border:none;border-radius:8px"></iframe>Category Leaderboard
Top 10 in Data & Infrastructure.
<iframe src="https://indexator.ai/api/embed/leaderboard?category=Data%20%26%20Infrastructure" width="300" height="400" frameborder="0" style="border:none;border-radius:8px"></iframe>hope it burns
Not bad at all for simple, colorful charts. Pretty straightforward to figure out.
Beatiful, easy and AI insights very useful.